RESULTS
Basic information of included studies
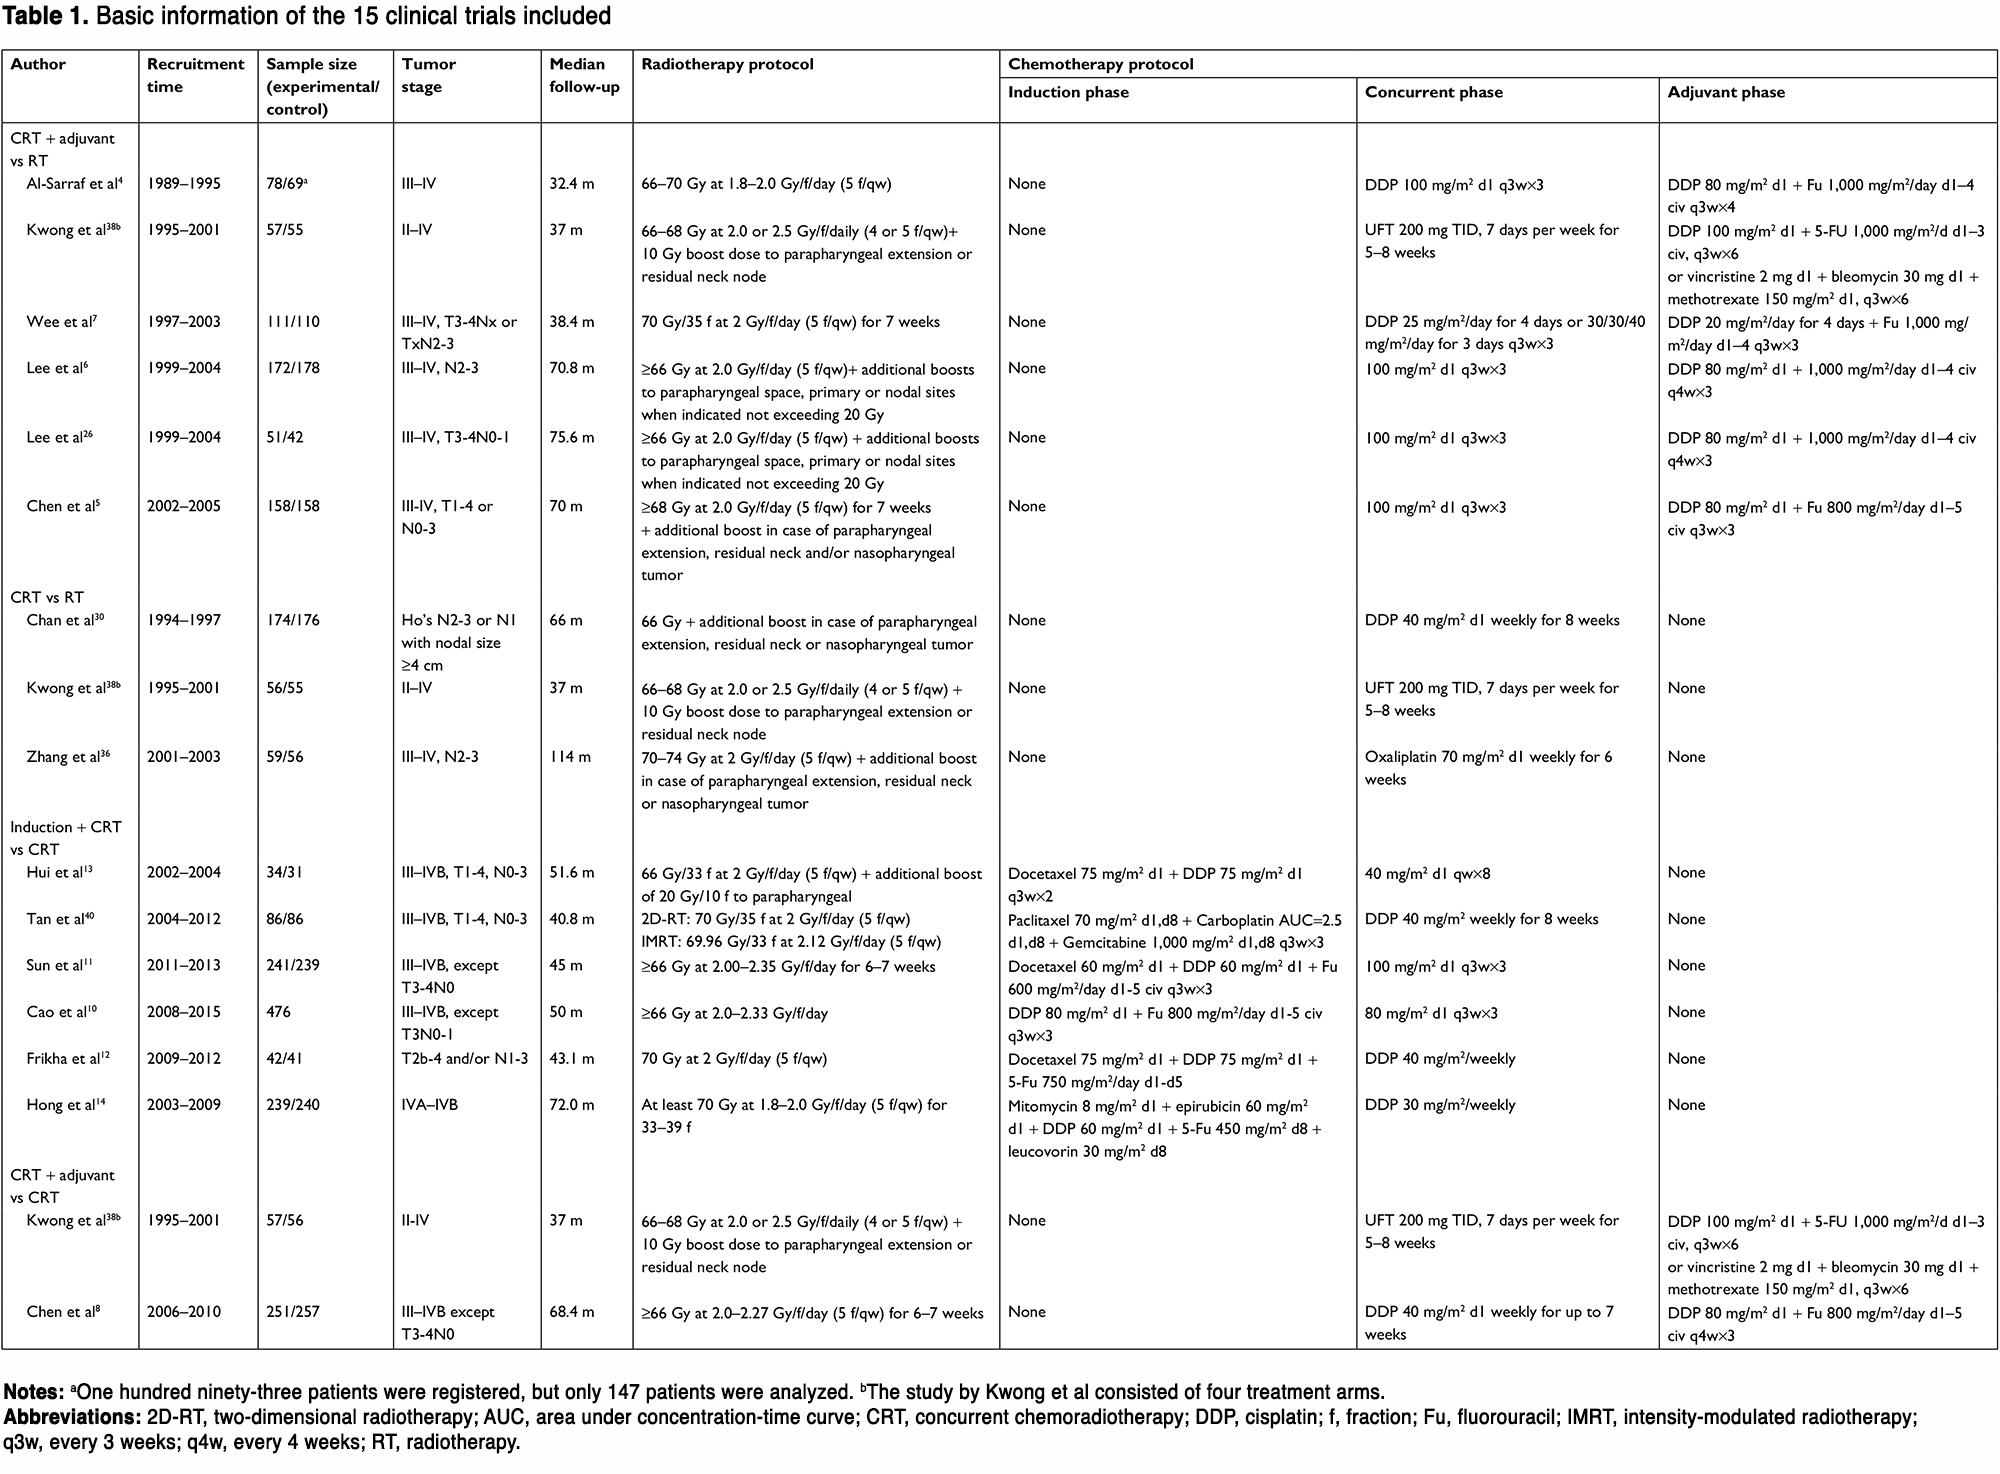
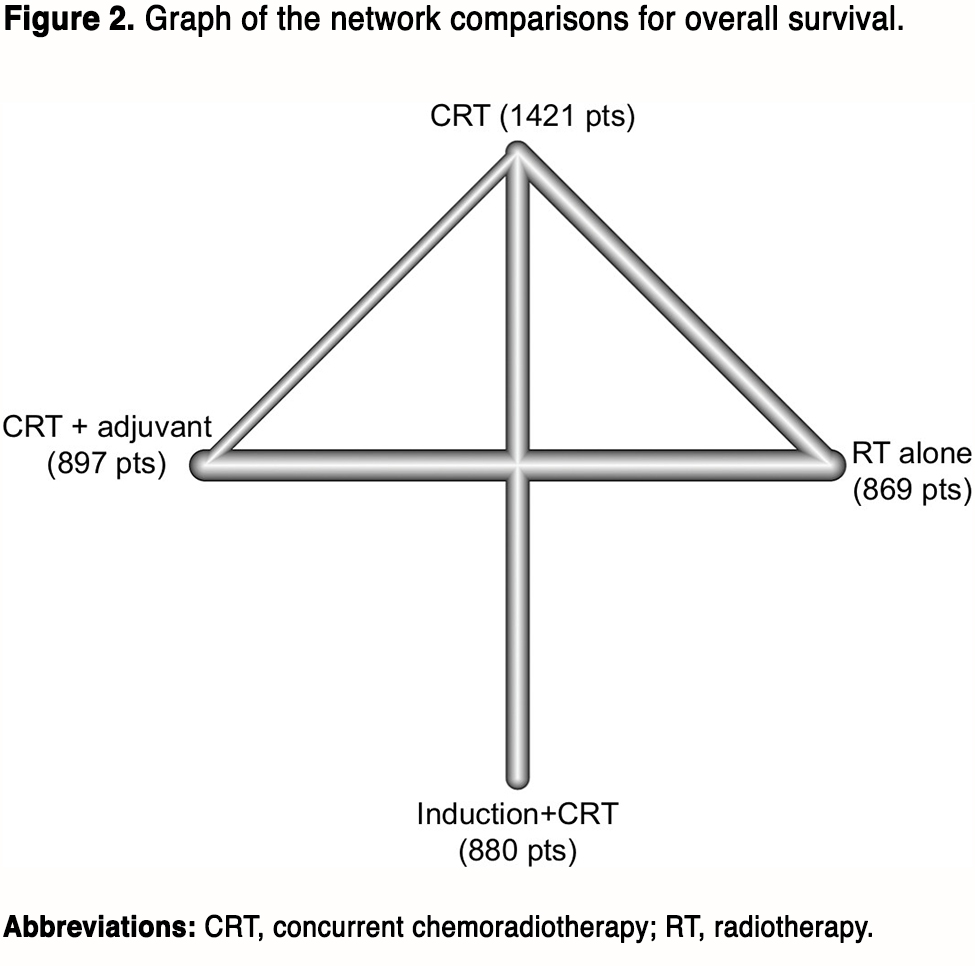
By the last searching (August 2018), we totally identified 26 potentially eligible clinical trials and the flowchart is presented in Figure S1 (see original article Supplemental Materials). The study by Lin et al22 comparing CRT with RT alone was excluded because HRs and 95% CIs were not provided in the original text. We also excluded two studies which recruited patients with stage II disease.23,24 Moreover, the study by Lee et al25 consisting of six treatment arms was not included because HR was not provided for each comparison. Two treatment arms in the study by Lee et al26,27 receiving accelerated-fraction RT were not included but the other arms were included. Nevertheless, six studies updated their follow-up data: Chen et al comparing CRT + adjuvant with CRT,28,29 Chan et al comparing CRT with RT,30,31 Lee et al comparing CRT + adjuvant with RT,6,32 Chen et al comparing CRT + adjuvant with RT,33,34 Lee et al comparing CRT + adjuvant with RT,26,27 and Zhang et al and Wu et al comparing CRT with RT.35,36 Finally, 15 studies were included for our study4–8,10–14,35,37–40 and the basic information is shown in Table 1. Overall, these 15 trials recruited 4,067 patients with 880 (21.6%) patients receiving induction + CRT, 897 (22.1%) receiving CRT + adjuvant, 1,421 (34.9%) receiving CRT, and 869 (21.4%) receiving RT alone. The Jadad/Oxford score for each trial is summarized in Table S1 (see original article Supplemental Materials). Obviously, most of the trials achieved good quality.
(To view a larger version of Table 1, click here.)
Pairwise meta-analysis between two treatment arms
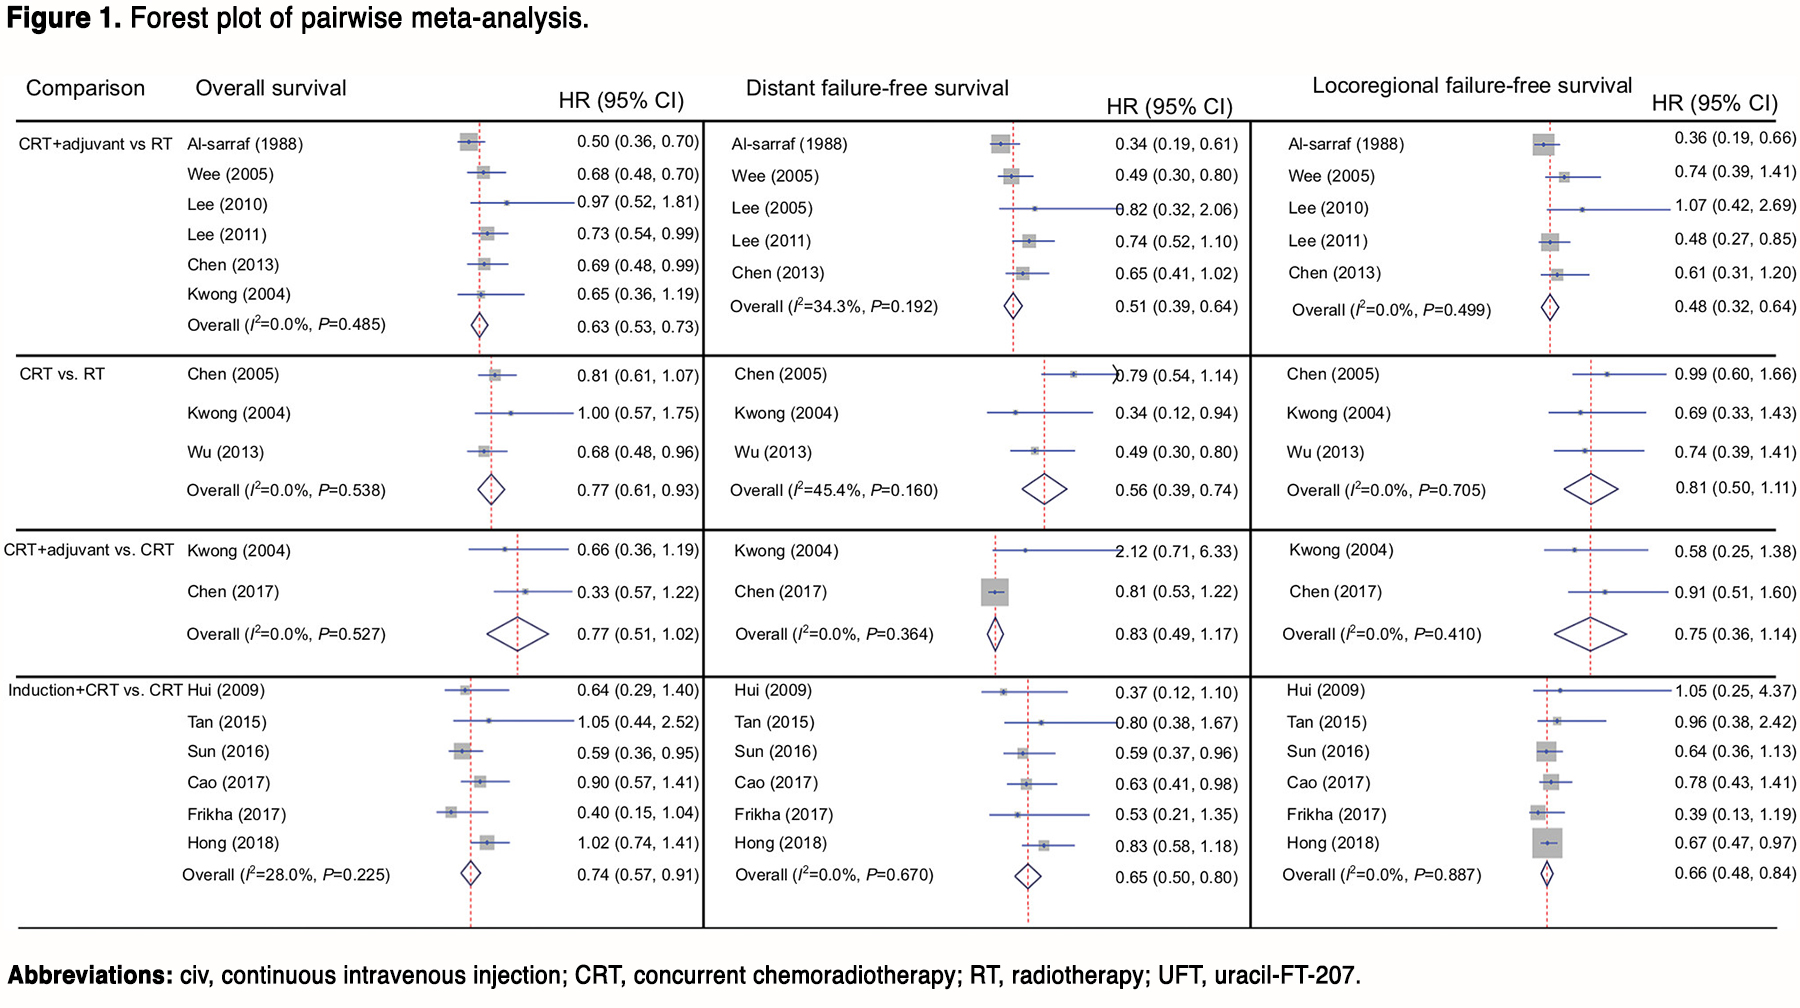
Figure 1 presents the results of all direct comparisons. As shown by the result, no significant heterogeneity exists between all comparisons for all the endpoints. Therefore, the fixed-effect model was employed for all analysis. Compared with RT alone, CRT + adjuvant achieved significantly better OS (HR, 0.63; 95% CI, 0.53–0.73), DFFS (HR, 0.51; 95% CI, 0.39–0.64), and LFFS (HR, 0.48; 95% CI, 0.32–0.64), while CRT was associated with better OS (HR, 0.77; 95% CI, 0.61–0.93) and DFFS (HR, 0.56; 95% CI, 0.39–0.74) but not LFFS (HR, 0.81; 95% CI, 0.50–1.11). As expected, no significant difference was found between CRT + adjuvant and CRT. Moreover, induction + CRT achieved significantly better OS (HR, 0.74; 95% CI, 0.57–0.91), DFFS (HR, 0.65; 95% CI, 0.50–0.80), and LFFS (HR, 0.66; 95% CI, 0.48–0.84).
(To view a larger version of Figure 1, click here.)
Network comparison between multiple treatment arms
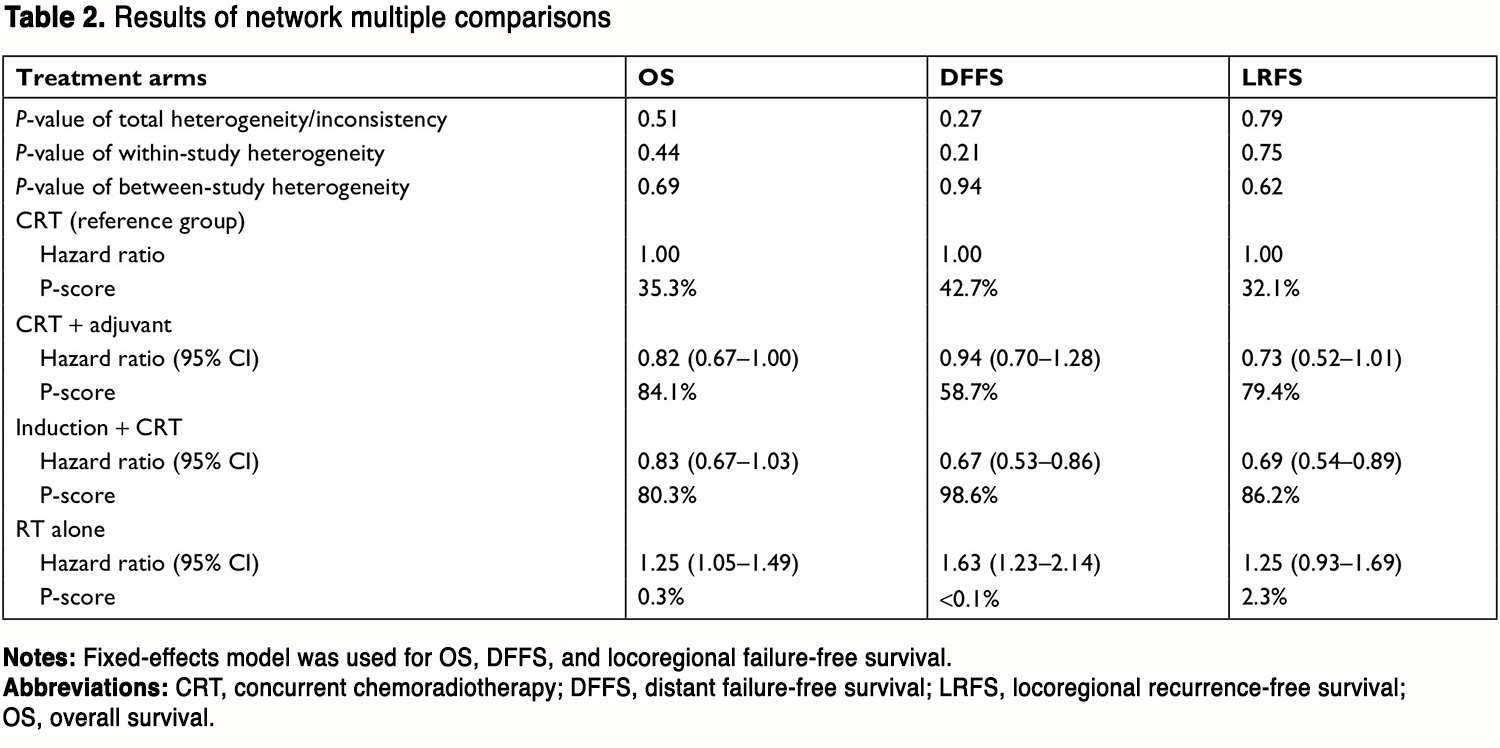
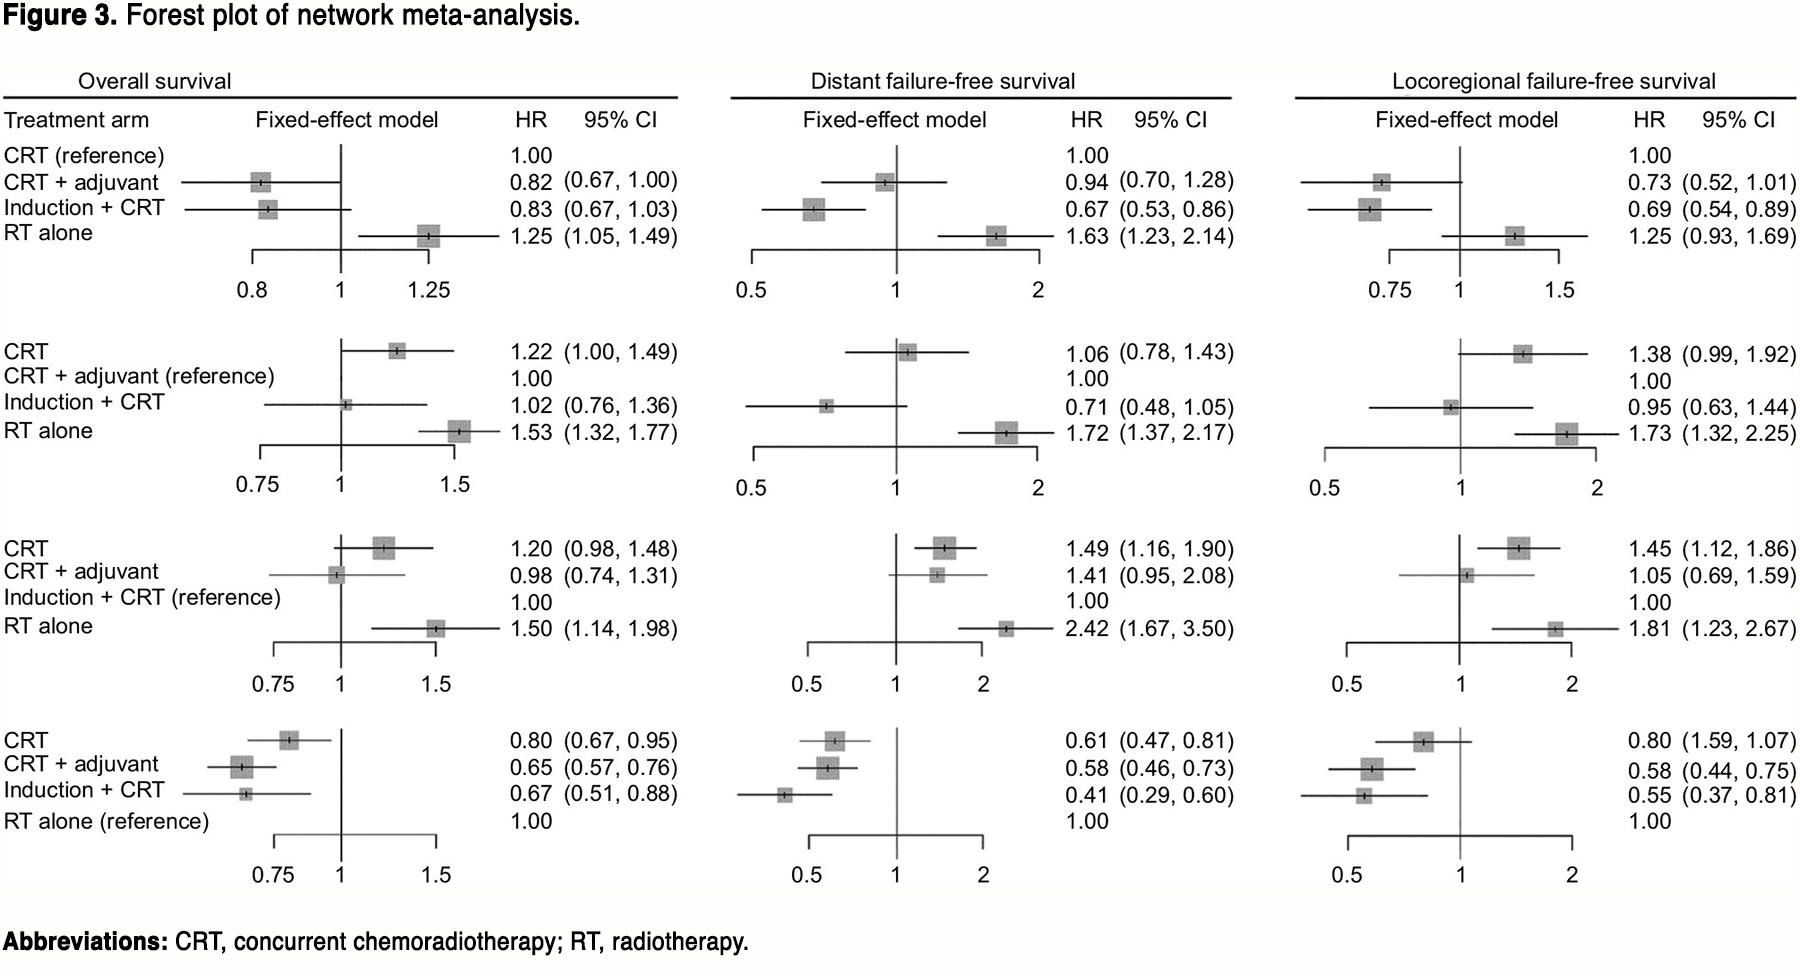
The network plot of multiple treatment comparisons is presented in Figure 2. No significant between-study or within-study heterogeneity was found between all comparisons (Table 2), and the fixed-effect model was therefore applied. The forest plot of multiple treatment comparisons in the network meta-analysis is shown in Figure 3.
(To view a larger version of Table 2, click here.)
(To view a larger version of Figure 3, click here.)
Compared with CRT, CRT + adjuvant achieved significantly better OS (HR, 0.82; 95% CI, 0.67–1.00), while RT alone achieved significantly worse OS (HR, 1.25; 95% CI, 1.05–1.49). However, no statistical difference was found between induction + CRT and CRT (HR, 0.83; 95% CI, 0.67–1.03). After changing the reference group, CRT + adjuvant did not significantly differ from induction + CRT (HR, 1.02; 95% CI, 0.76–1.36); while RT alone was poorer than both CRT + adjuvant (HR, 1.53; 95% CI, 1.32–1.77) and induction + CRT (HR, 1.50; 95% CI, 1.14–1.98). The P-scores for CRT, CRT + adjuvant, induction + CRT, and RT alone were 35.3%, 84.1%, 80.3%, and 0.3%, respectively (Table 2), suggesting that CRT + adjuvant achieved the higher possibility of becoming the best treatment for OS.
For the endpoint of DFFS, induction + CRT was better than CRT (HR, 0.67; 95% CI, 0.53–0.86), while no significant difference was found between CRT and CRT + adjuvant (HR, 0.94; 95% CI, 0.70–1.28) or between CRT + adjuvant and induction + CRT (HR, 0.71; 95% CI, 0.48–1.05). Notably, RT alone was worse than the other three treatments. Undoubtedly, induction + CRT achieved highest P-score of 98.6% (Table 2), indicating that induction + CRT may be the best choice for reducing distant failure.
With regard to LFFS, induction + CRT was better than CRT (HR, 0.69; 95% CI, 0.54–0.89) and RT alone (HR, 0.55; 95% CI, 0.37–0.81). Moreover, CRT + adjuvant was also better than RT (HR, 0.58; 95% CI, 0.44–0.75). Otherwise, no significant difference was identified between other comparisons. Similarly, induction + CRT still achieved the highest P-score of 86.2% (Table 2).
Given these findings, CRT + adjuvant may be a better treatment for improving OS, while induction + CRT was better in reducing distant failure and locoregional failure.
Sensitivity analysis
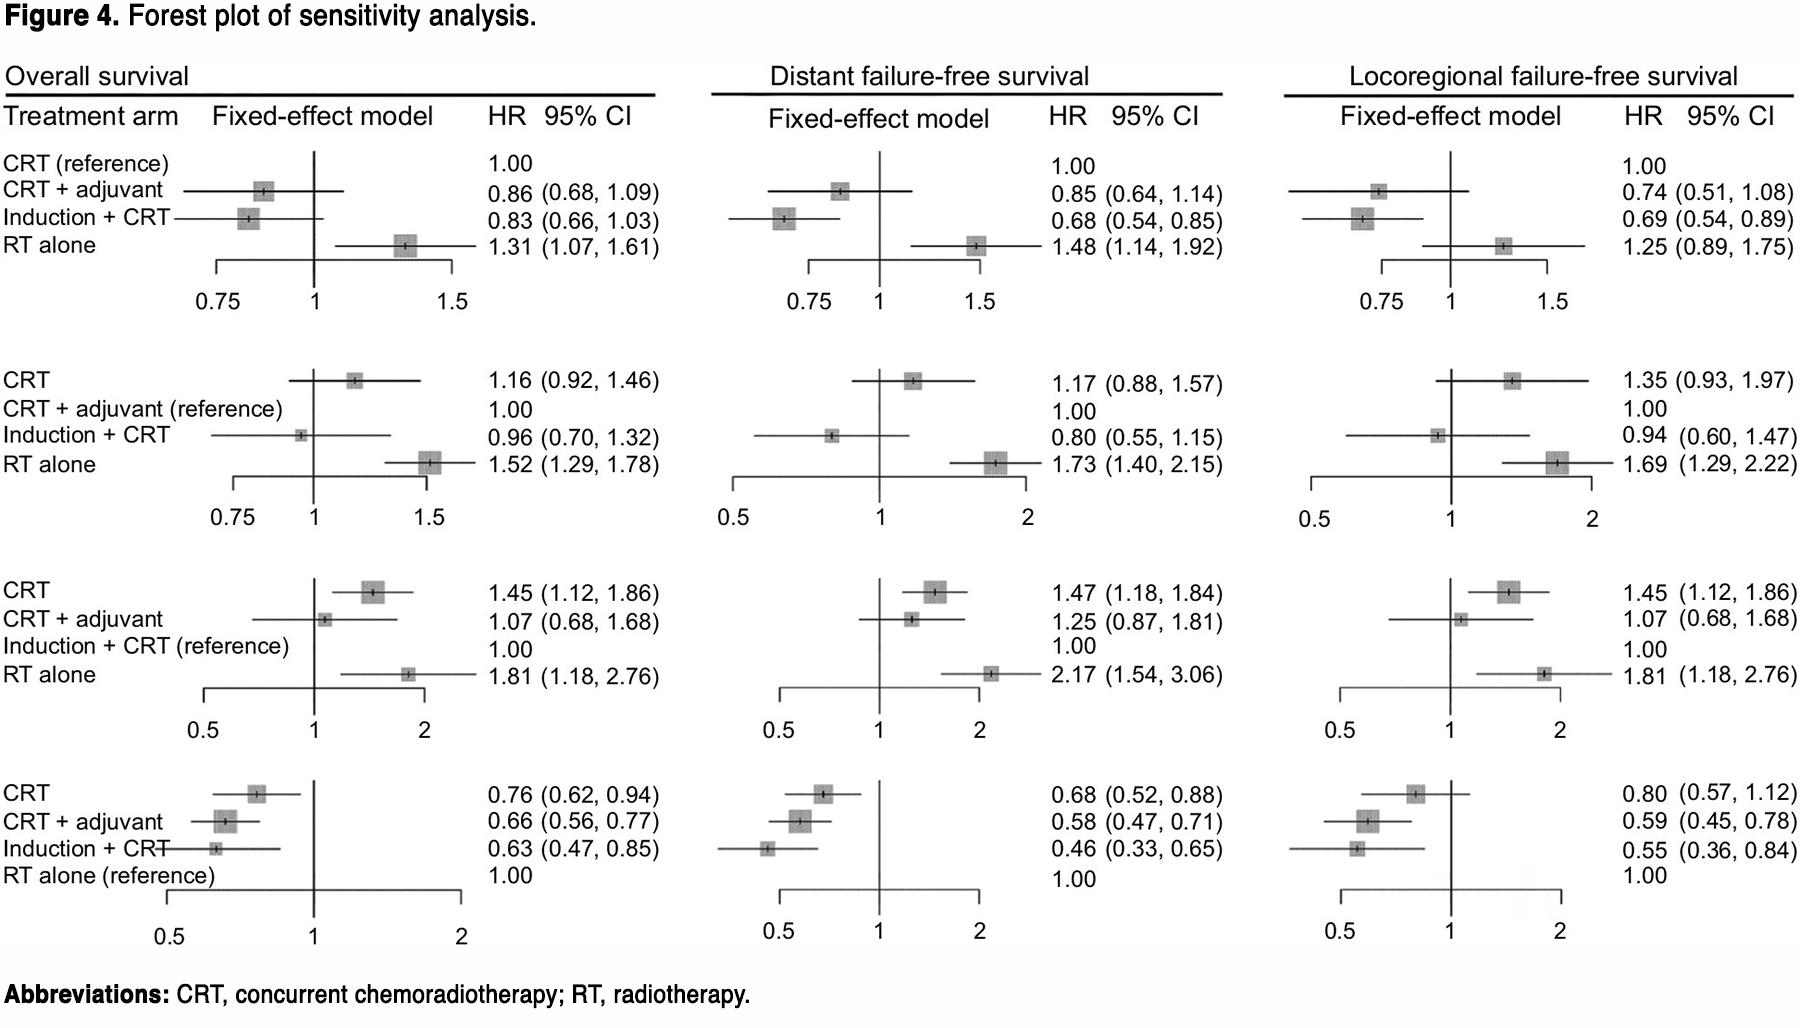
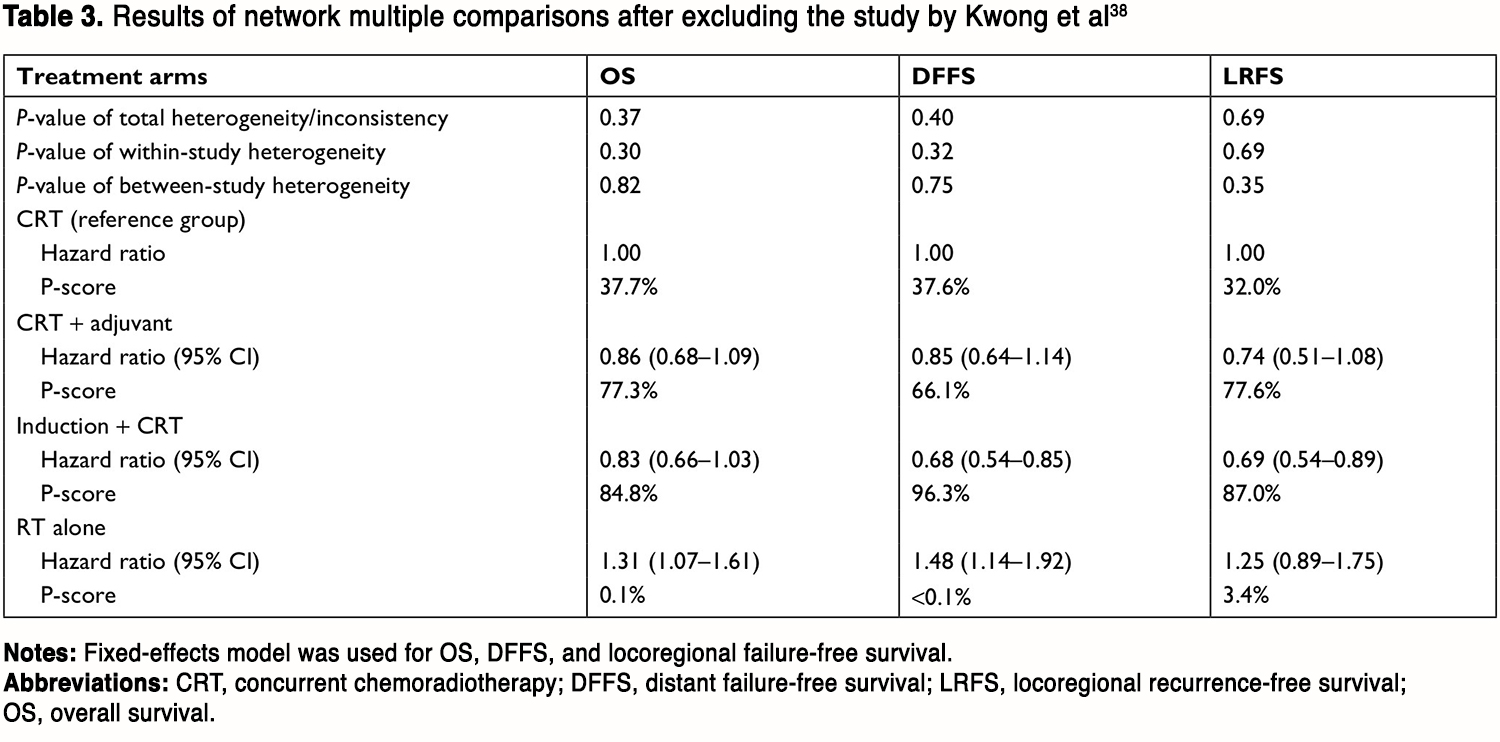
To validate the stability of our findings, we performed sensitivity analysis after excluding the study by Kwong et al38 because the chemotherapeutic agent used during RT is not platinum. The network plot was shown in Figure S2 (see original article Supplemental Materials). As indicated by the results (Figure 4, Table 3), induction + CRT was still better than CRT in terms of DFFS (HR, 0.68; 95% CI, 0.54–0.85) and LFFS (HR, 0.69; 95% CI, 0.54–0.89), while no significant difference between CRT + adjuvant and CRT, or between induction + CRT and CRT + adjuvant was found. RT alone was still worse than the other treatments. Intriguingly, induction + CRT achieved the highest P-score on OS, DFFS, and LFFS. Taken these together, our results remained valid in sensitivity analysis.
(To view a larger version of Figure 4, click here.)
(To view a larger version of Table 3, click here.)
